
- AI Analyst explains performance changes quickly for teams
- Unlimited users help growing agency reporting teams
- Strong connectors support common business reporting tools

Databox
AI-powered dashboards for business performance
SF8.4
SF Score editorial score across features, ease, and value, based on public reviews and product research. Learn more →
agency reportingmarketing analyticsbusiness dashboards
agency reportingmarketing analytics
Best for
Agencies tracking client performance metrics
Pricing
From $159/mo
Free plan
Available
SoftFinders Score
8.4 / 10
Overview
What is Databox?
Databox is a business performance analytics platform for bringing KPIs from marketing, sales, finance, ecommerce, and other business systems into shared dashboards and recurring reports. It connects to 130+ integrations and also accepts data from Excel, Google Sheets, SQL and NoSQL databases, cloud warehouses, and custom API connections. Teams can define custom metrics with calculations, filters, dimensions, and segments, track goals, detect anomalies, and prepare datasets that combine or reshape source data for further analysis.
- Best fit: Agencies and consulting teams that need to standardize reporting across many client accounts. Databox supports reusable dashboard and report templates, separate client accounts, automated scorecards and reporting, performance summaries, and branded client experiences. Genie, its AI analyst, can answer questions about connected performance data, investigate trends and anomalies, and build metrics, dashboards, and datasets from conversational requests.
- Check first: Agency plan boundaries change both scale and analytical depth. Agency Starter begins at $79/month when billed annually and includes five client accounts, while Agency Pro starts at $159/month and introduces unlimited client accounts, unlimited dashboards and reports, and broader data connectivity. Agency Growth adds full dataset preparation, forecasting, 15-minute syncing for supported sources, and a dedicated customer success manager. White-labeling is available as an add-on on lower agency tiers and included with Agency Premium.
Bottom line: Databox is particularly useful when an agency wants one repeatable reporting system for many clients—combining data from multiple platforms, standardizing KPIs, automating recurring reporting, and giving account teams an AI-assisted way to investigate performance without maintaining a traditional BI stack.
KEY FEATURES
What you get out of the box
AI Analyst
Ask plain-language questions about business performance
Dashboard Builder
Create KPI dashboards from connected sources
Goal Tracking
Monitor targets and progress across teams
Automated Reports
Send scheduled updates to stakeholders automatically
Data Connectors
Connect marketing, sales, and finance tools
Benchmark Data
Compare performance against relevant business benchmarks
USE CASES
Where teams put it to work
Track client marketing performance dashboards
Send automated weekly executive reports
Monitor sales and revenue goals
Explain metric changes using AI
Build agency reporting portals for clients
Combine SaaS metrics into one view
Editorial Take
What we like, and what to verify
- Data source pricing can grow quickly at scale
- Deep BI modeling is not the focus
- Advanced security features cost extra on paid plans
Screenshots
A look inside
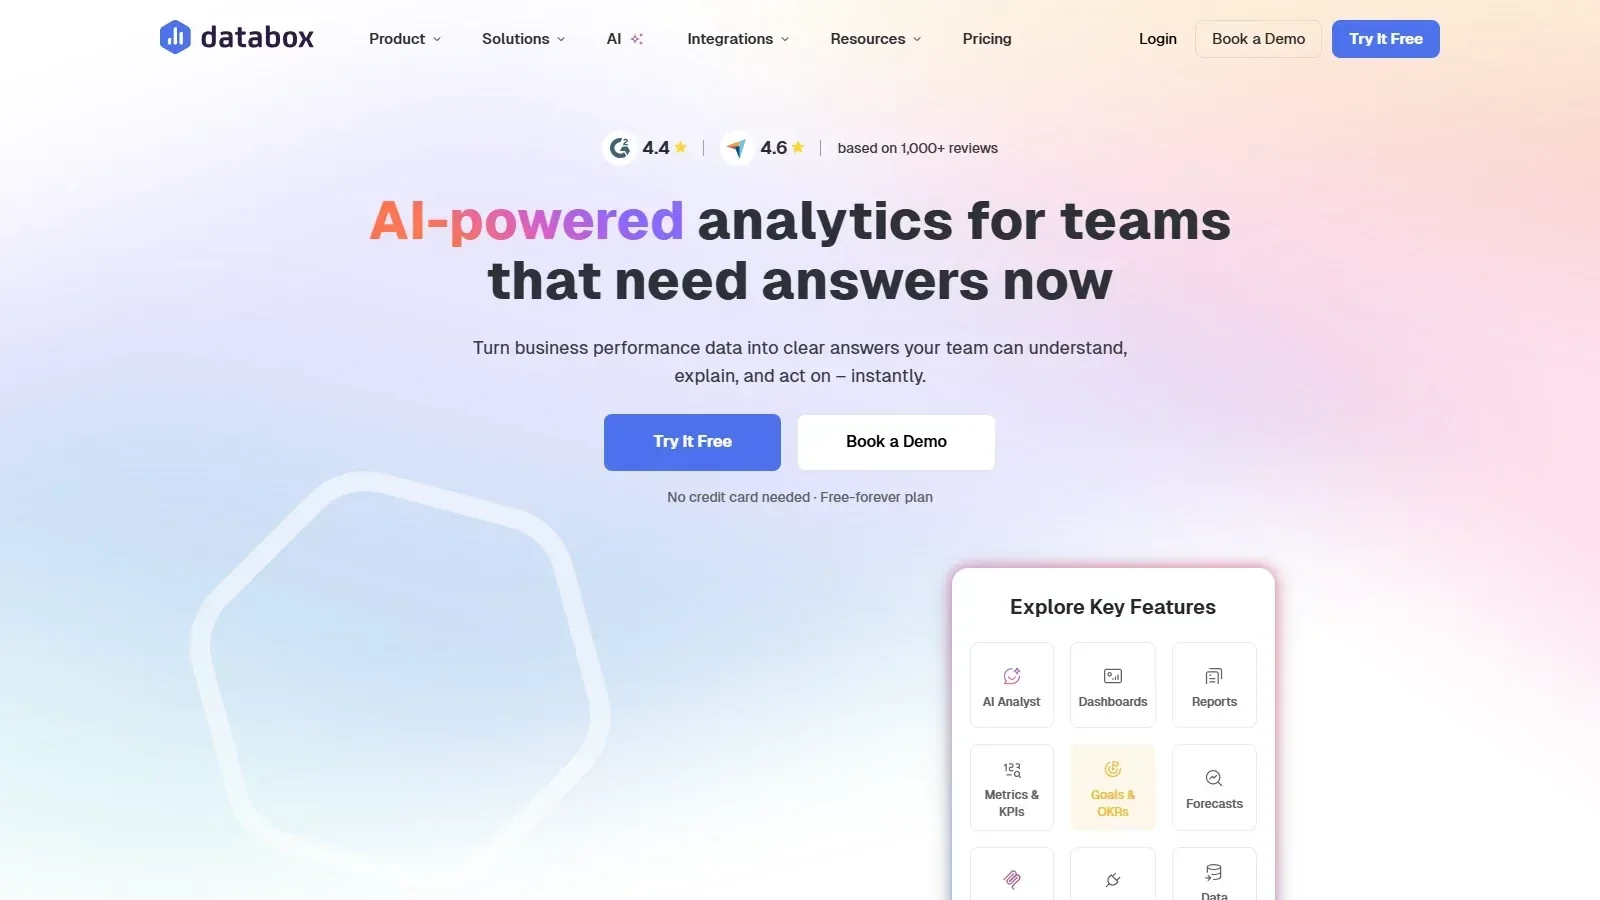 Databox homepage screenshot
Alternatives
Tools to consider next

Metabase SF 8.5
Why consider it
Open-source BI with AI-assisted querying

Cloudera SF 8.4
Why consider it
Hybrid data platform for enterprise AI

Starburst SF 8.5
Why consider it
Federated analytics for AI-ready data

Denodo SF 8.4
Why consider it
Logical data management for AI analytics

Informatica SF 8.7
Why consider it
AI-powered enterprise data management platform

Qlik Talend SF 8.3
Why consider it
AI-ready data integration and quality
FAQ