
- Strong streaming support for operational analytics teams
- Statistical and geospatial depth exceeds standard BI
- Copilot adds useful AI-assisted exploration workflows clearly

TIBCO Spotfire
Technical analytics for data-heavy industries
SF8.5
SF Score editorial score across features, ease, and value, based on public reviews and product research. Learn more →
industrial analyticsSpotfire analyticsstreaming analytics
industrial analyticsSpotfire analytics
Best for
Technical teams exploring complex live data
Pricing
Custom
SoftFinders Score
8.5 / 10
Overview
What is TIBCO Spotfire?
TIBCO Spotfire, now branded simply as Spotfire, is a visual industrial analytics platform that combines interactive data exploration, visualization, data preparation, statistical analysis, geoanalytics, and AI-assisted investigation for analysts, engineers, scientists, and operational teams.
- Analytics role: users can connect disparate data sources, build interactive visualizations, prepare data, perform spatial and statistical analysis, and investigate time-series, multivariate, and operational patterns within the same visual environment.
- AI capabilities: Spotfire 15.0 introduces Visual AI and Insight Agents that surface patterns, anomalies, and recommended investigative steps during analysis while keeping the domain expert in control of interpretation. Custom Insight Agents can also encode organization-specific analytical knowledge.
- Operational fit: buyers should assess data connectivity, governance, deployment architecture, Python or R requirements, real-time analytics, industrial workflows, and whether the advanced modeling and Statistica capabilities included with Spotfire Industry Pro are required. Enterprise deployments add centralized governance, sharing, automation, and cloud, on-premises, or hybrid deployment capabilities.
- Commercial considerations: Spotfire Analytics lists at $3,000 per user per year, excluding tax. Spotfire Industry Pro adds advanced industrial analytics and Spotfire Statistica, while Spotfire Enterprise provides the server infrastructure, governance, collaboration, and deployment capabilities needed to operate Spotfire across larger organizations.
Spotfire is particularly relevant to organizations that need interactive visualization and advanced analytics closely connected to expert-led investigation, statistical analysis, and industrial decision-making rather than conventional dashboard reporting alone.
KEY FEATURES
What you get out of the box
Streaming Analytics
Analyze live operational and telemetry data
Spotfire Copilot
Use AI assistance for analytical exploration
Statistical Functions
Run advanced models inside analytical workflows
Geoanalytics Tools
Map and analyze location-based business data
Action Controls
Trigger workflow actions from dashboard interactions
Data Connections
Connect files, databases, and streaming sources
USE CASES
Where teams put it to work
Monitor industrial telemetry and operations
Explore scientific and research datasets
Analyze geographic performance and risk
Support energy and manufacturing analytics
Create dashboards for technical users
Investigate anomalies in live data
Editorial Take
What we like, and what to verify
- Interface can feel heavy for casual users
- Smaller community than mainstream BI platforms clearly
- Basic dashboard teams may find it excessive
Screenshots
A look inside
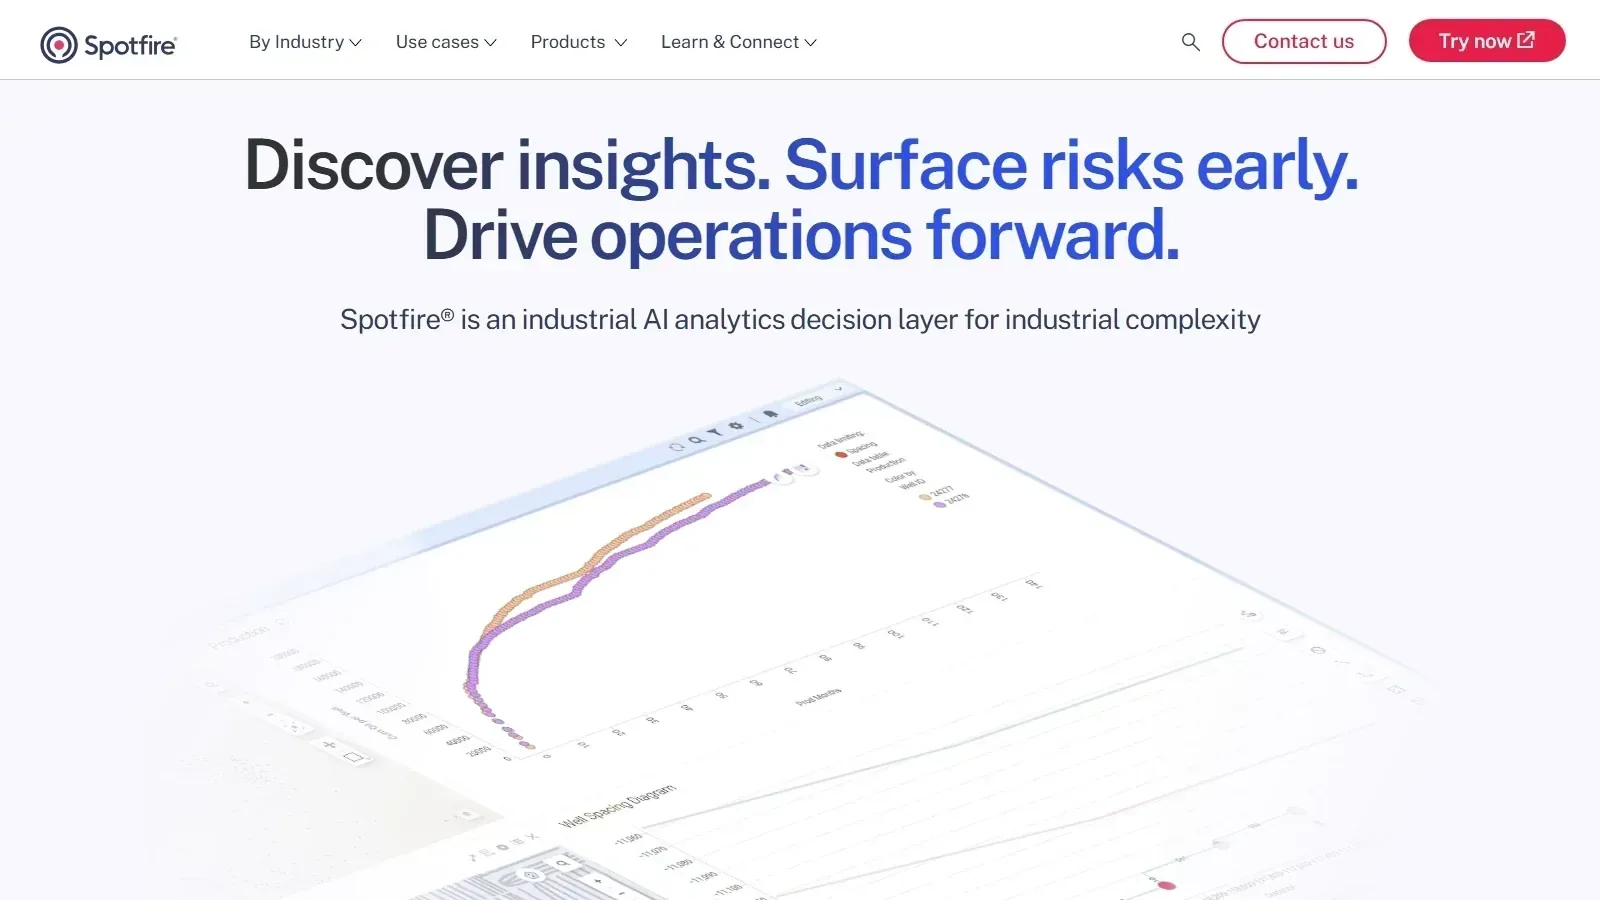 TIBCO Spotfire homepage screenshot
Alternatives
Tools to consider next

SAP Analytics Cloud SF 8.4
Why consider it
SAP-native BI and planning analytics

Alteryx SF 8.5
Why consider it
Analytics automation for repeatable data workflows

MicroStrategy SF 8.4
Why consider it
Semantic analytics for large enterprises
IBM Cognos Analytics SF 8.3
Why consider it
Enterprise reporting with AI-assisted exploration

Tableau SF 8.7
Why consider it
Visual analytics for governed dashboard teams
FAQ