
- Free tier helps teams start observability
- AI assistant supports faster incident investigation
- Full-stack view connects many telemetry signals

New Relic
AI-assisted observability for full-stack investigations teams
SF8.8
SF Score editorial score across features, ease, and value, based on public reviews and product research. Learn more →
Full Stack TriageobservabilityAI monitoring
Full Stack Triageobservability
Best for
Teams investigating full-stack service incidents
Pricing
Free tier available
Free plan
Available
SoftFinders Score
8.8 / 10
Overview
What is New Relic?
New Relic is an AI-powered observability platform for teams that need application, infrastructure, log, security, and AI monitoring across one telemetry stack. It correlates signals and provides an AI assistant for investigation, reporting, and instrumentation guidance. Its strength is full-stack visibility: teams can move from symptoms to likely causes faster. That keeps investigations grounded in connected signals across the stack during production incidents reliably.
It fits teams wanting a unified observability workspace with a free tier and usage-based expansion. Buyers should understand data ingest, user limits, and retention before scaling. New Relic is less focused on code-level error triage than Sentry; compare it with Datadog and Honeycomb. Adoption works best when teams test ingest budgets, user roles, incident workflows, and telemetry sources before expanding coverage across environments gradually.
KEY FEATURES
What you get out of the box
Telemetry Correlation
Connects logs, metrics, traces, and events clearly
AI Assistant
Helps investigate alerts and instrumentation gaps faster
Application Monitoring
Tracks performance across services and applications safely
Data Ingest
Organizes observability around telemetry volume planning reliably
Incident Intelligence
Finds likely causes across full-stack signals quickly
AI Monitoring
Observes AI applications for reliability concerns directly
USE CASES
Where teams put it to work
Full Stack Triage
AI Assistant Queries
Telemetry Cost Planning
Application Performance Review
Incident Coverage Gaps
AI Application Monitoring
Editorial Take
What we like, and what to verify
- Usage model requires ingest planning discipline
- Some teams may prefer code-level triage
- Broad platform needs ownership discipline upfront
Screenshots
A look inside
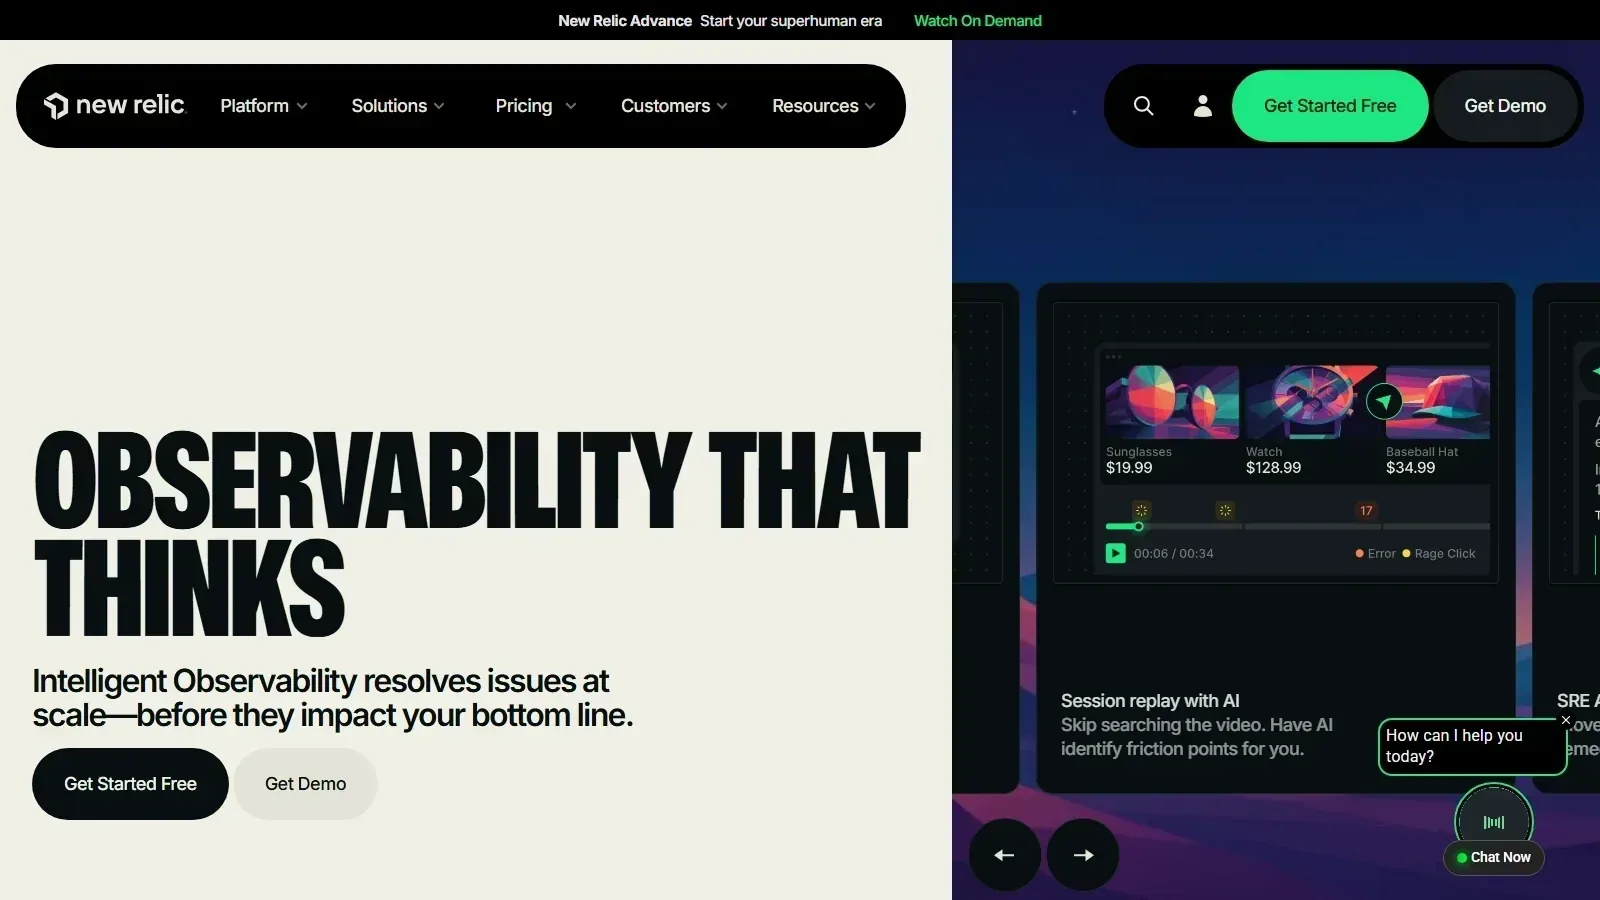 New Relic homepage screenshot
Alternatives
Tools to consider next
Datadog SF 9.2
Why consider it
Broad observability for complex production systems
Honeycomb SF 8.9
Why consider it
High-cardinality observability for production debugging teams

Sentry SF 9.1
Why consider it
Error monitoring for faster debugging decisions
Mabl SF 8.8
Why consider it
Low-code testing for resilient web workflows

Applitools SF 8.9
Why consider it
Visual AI testing for UI regressions

Sonar SF 9
Why consider it
Static analysis for governed code quality
FAQ